Reading the chart
The maturity wall
Most debt analysis asks how much a company owes. A maturity wall asks the question that actually arrives with a date on it: when does it have to find the money again?
Why the year matters more than the amount
A company with a large debt and nothing due for eight years has a problem it can plan around. A company with half as much debt and all of it due next spring has an appointment. The balance sheet reports both as a single number, and that number is the same on the day the debt was issued and the day before it matures.
What changes in between is the price of replacing it. A bond issued at 2% when money was cheap does not become expensive as rates rise — it stays at 2% until the day it is repaid, and only then does the new world arrive all at once. The wall is a picture of when that happens.
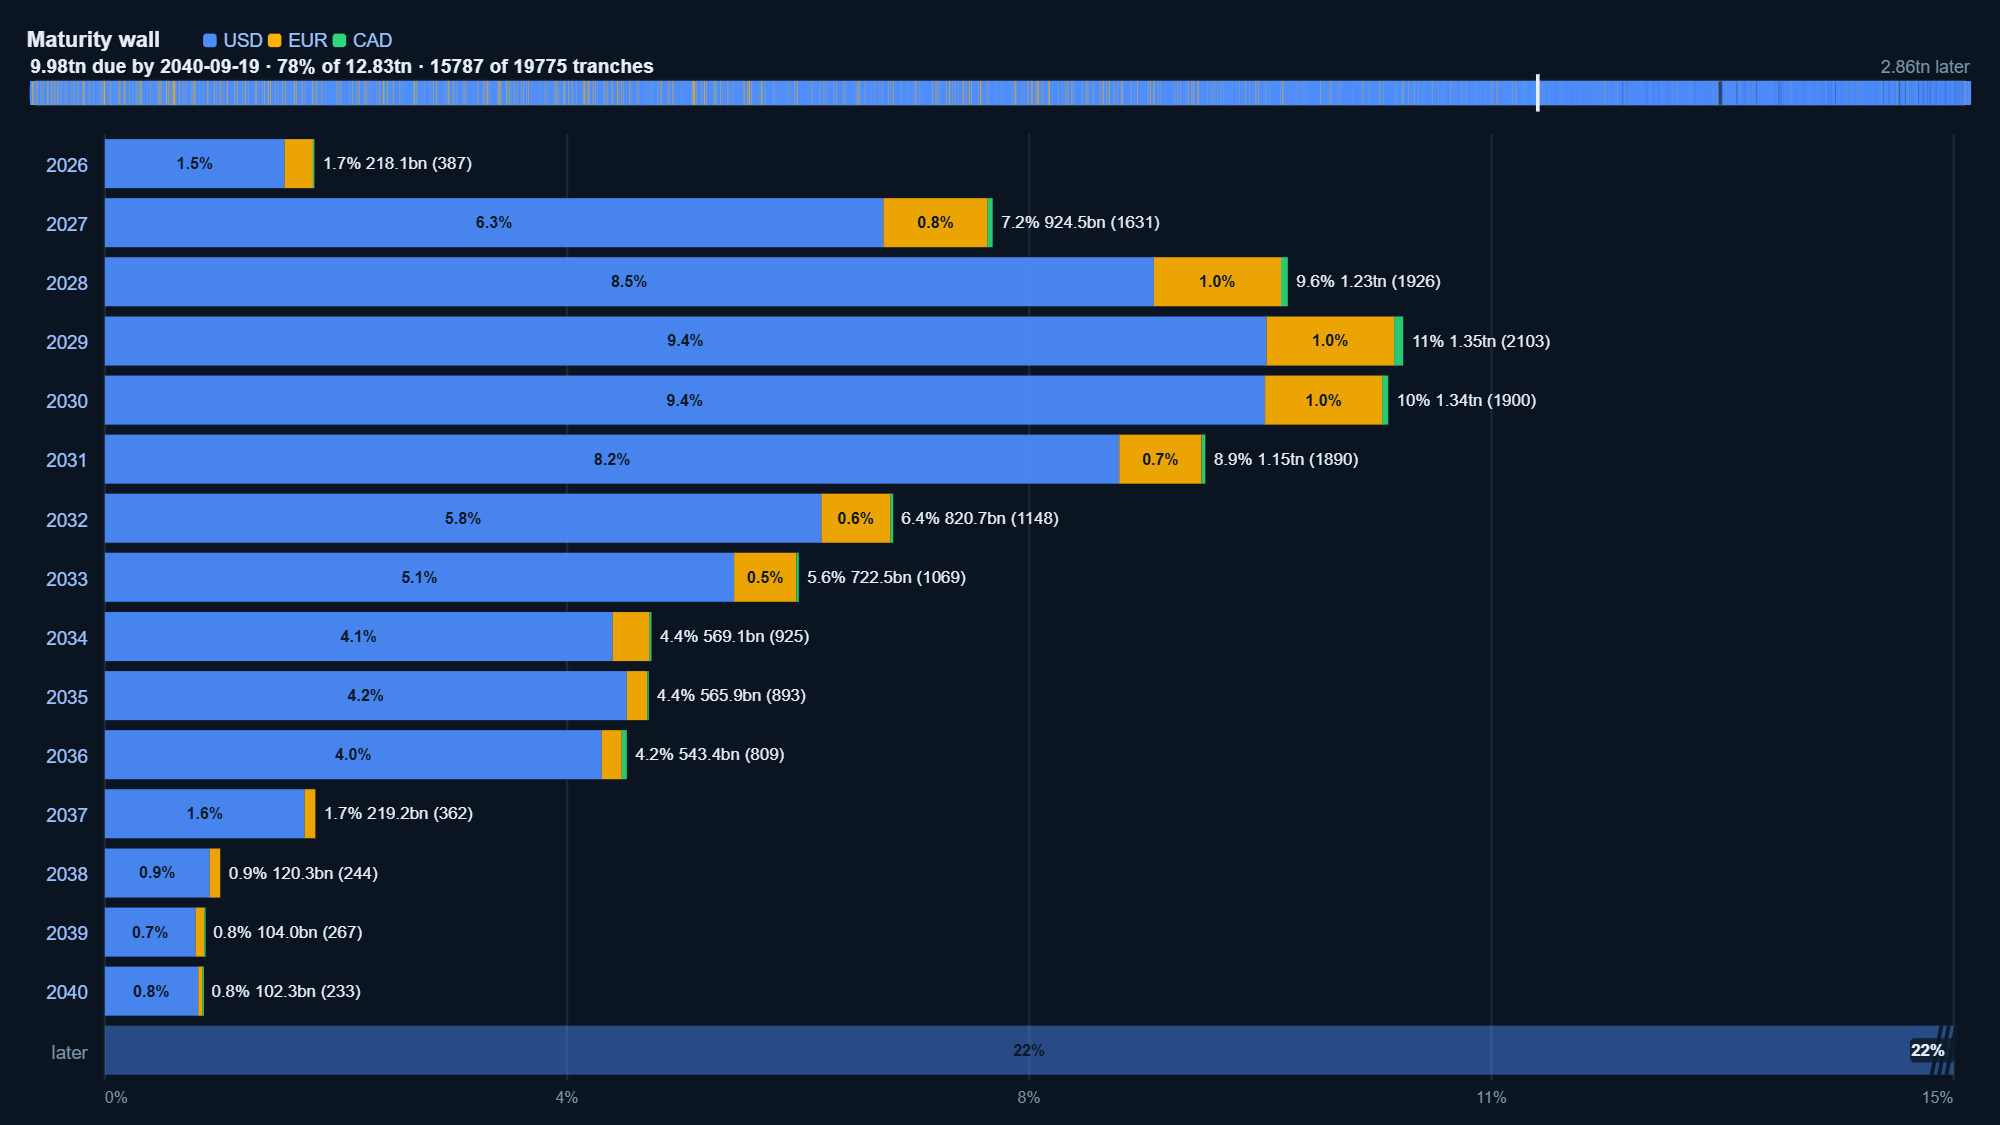
What counts as "due" is not obvious
A maturity date looks like a fact, and for a plain bond it is. The rest of a capital structure is less obliging, and a wall drawn from maturity dates alone will be wrong in the same direction every time: too comfortable.
| Instrument | The date that actually matters |
|---|---|
| Plain bond | Its maturity. The straightforward case. |
| Convertible with a put | The put date — the first day holders can demand cash back — not the maturity printed on it. If the shares are below the conversion price, that is the day the money is needed, and it is often years earlier. |
| Callable bond | Maturity, for planning purposes. A call is the issuer's option, not an obligation, and it will only be used when it suits the issuer. |
| Revolver or commercial paper | Continuously, in effect. Short-term funding is a standing refinancing question rather than a dated one. |
| Leases | Spread across their terms. They are debt-like obligations and belong in the total even when no bond screen lists them. |
The convertible case is the one that moves numbers most. A company can report a comfortable maturity profile while its own repayment schedule — the one in its filings — is built around put dates that fall years earlier. This site uses the put date for that reason.
Three shapes, three different stories
A cliff
One year carrying a large share of everything. The date is now a real constraint: it will be refinanced early, in one large transaction, on whatever terms exist then.
A ladder
Roughly even bars stretching out for years. Each year's repayment is small enough to be handled from cash flow or a routine issue. This is what a treasury team is paid to build.
Two other readings sit on the same picture. Currency: debt due in euro has to be found in euro, and converting every bar into one currency hides that. And concentration: one year made up of a single issuer's bonds is a different risk from the same year spread across a dozen.
What climbing it costs
The wall says when. The question that follows is what the money will cost when it gets there, and that has a calculable answer: take each year's maturing debt, look at what the company pays on it now, and compare that with what the same borrower is being charged today for money of that length.
The difference is the extra interest bill that arrives if the debt is rolled rather than repaid. Expressed in millions it sounds abstract; expressed as a share of operating profit it stops being abstract, which is how it is worth reading.
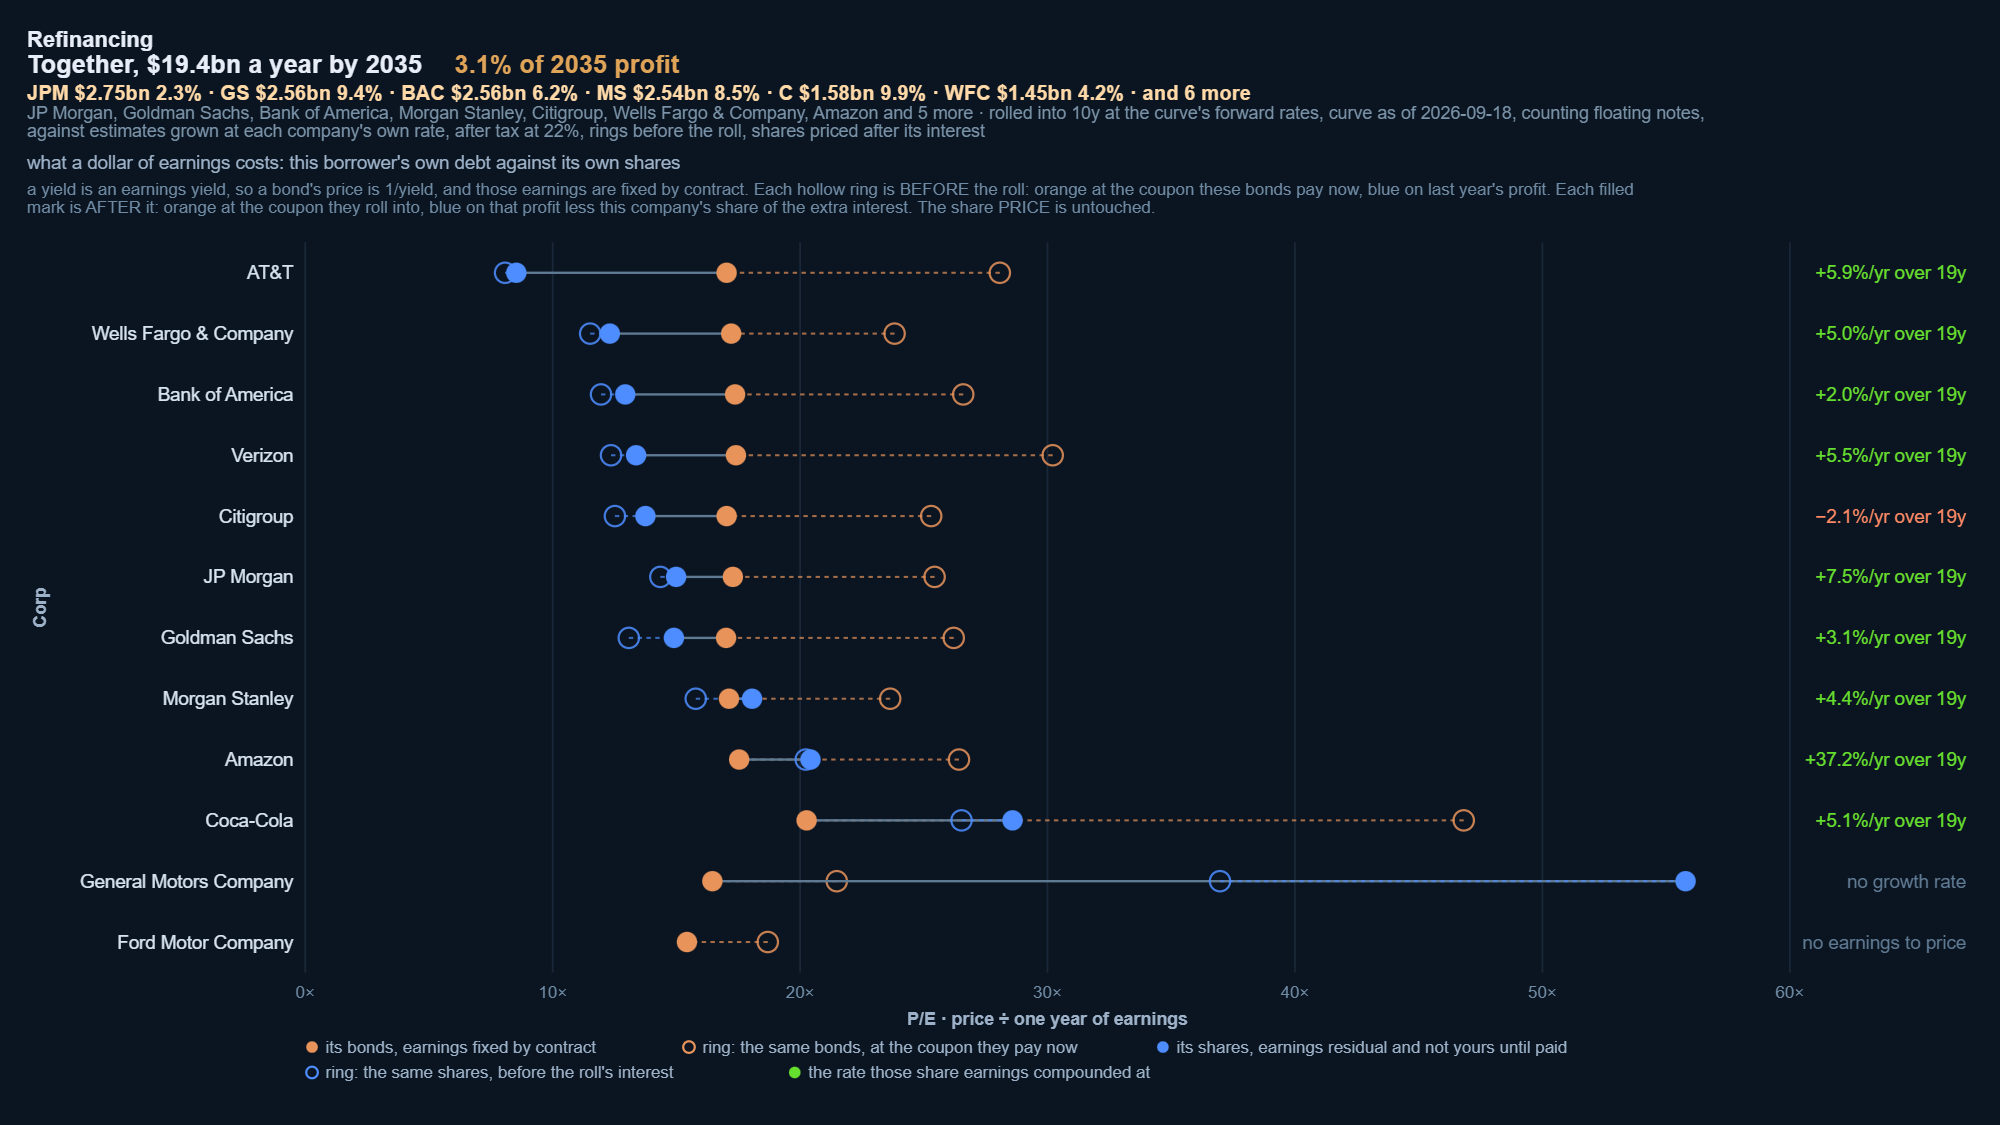
A wall is only frightening in the company of two other numbers: what the refinancing costs, and what the company earns. On its own it is a schedule, not a verdict.
What the wall leaves out
Every bond screen shows listed bonds, which for many companies is not most of the debt. Bank loans, private placements, commercial paper, leases and direct lending never appear — and the gap between the reported total debt and the sum of the listed bonds is often the larger half.
That gap has to be named rather than ignored. The honest treatment is to reconcile the two: take the company's own reported total, subtract what the bond board can account for, and say what is left. What that remainder does is then an assumption you choose — it might roll on the same terms as the listed bonds, or reprice immediately like a floating bank facility — and the answer changes materially depending on which you pick.
Finance companies are a case apart. Their liabilities are funding for assets that reprice just as quickly, so charging them for one side of that invents a loss that does not exist.
Four ways to misread a wall
- Assuming repayment. Most maturing corporate debt is refinanced, not repaid. The question is the price of the new money, not whether the cash exists.
- Ignoring the other side of the balance sheet. A large bar in front of a large cash pile is an administrative event. The wall says nothing about cash, and it should not be read as though it did.
- Reading a market wall as a company wall. An entire market's debt stacking up in one year is a fact about the market's issuance history, not about any single borrower in it.
- Forgetting who the borrower is. A subsidiary's bonds may be the parent's problem, or may not. Entities matter, and a wall built by matching names has to get that matching right before anything it shows is worth reading.
Reading one in practice
Start with the shape, then the next three years, then the cost. If the next three years are small relative to operating profit, the wall is not the story and something else is. If one year is large, the useful questions are narrow and answerable: which issuer, which currency, what is it paying now, and what would the same money cost today?
That is the sequence the corporate bond page is built around — the wall, the refinancing cost beside it, and the reconciliation of listed bonds against the company's own reported debt, read from its filings rather than estimated.
Every issuer on the board, its wall and what refinancing it would cost — free, no sign-up.
Open the charts →Also worth reading: What is a Relative Rotation Graph? · Why measure stocks in gold? · Reading RS-price divergence